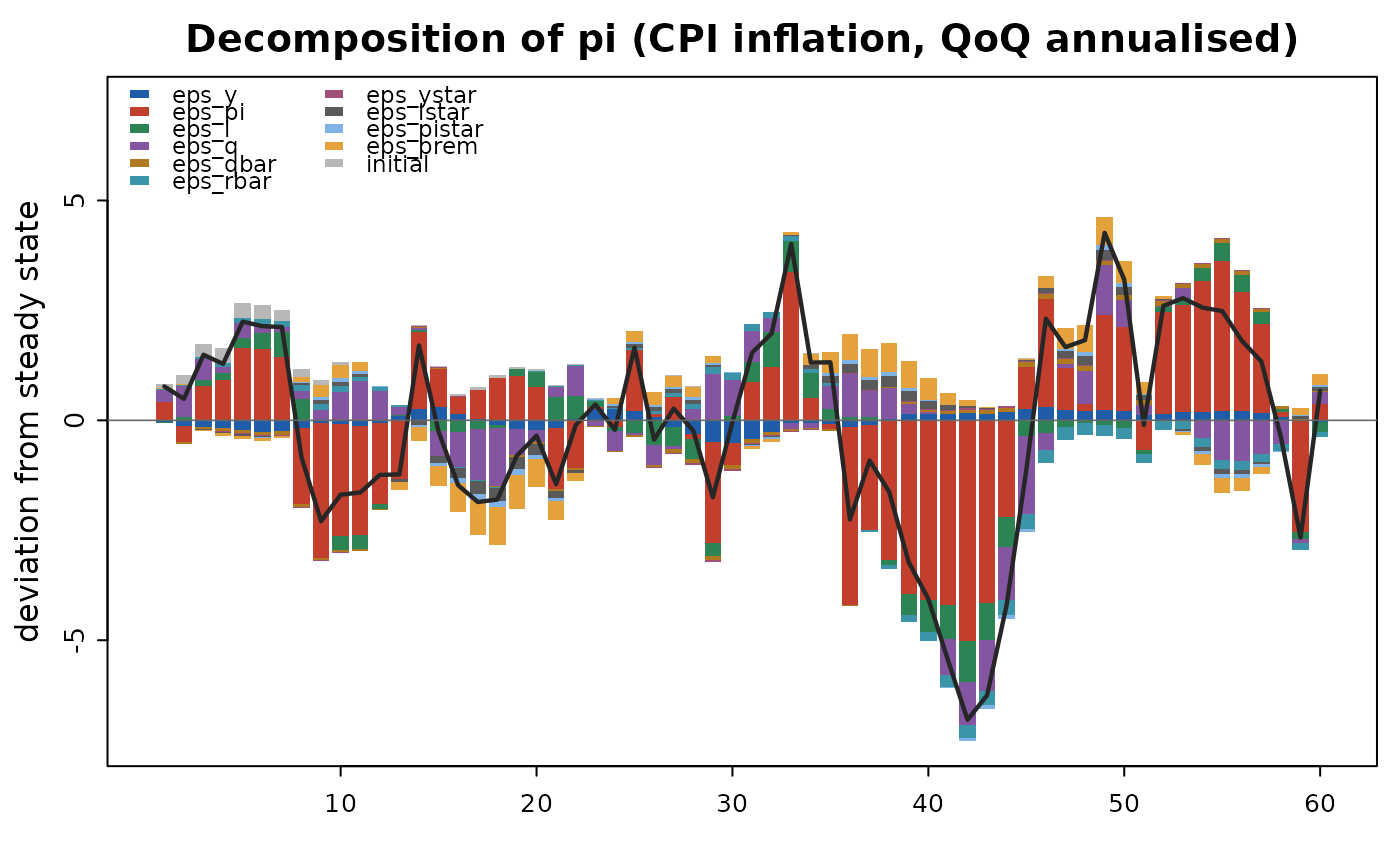
Splits the smoothed history of every variable into the additive contributions of each structural shock plus the carry-over of the pre-sample initial state: with smoothed shocks \(e_t\), $$a_t = sum_j c_j(t) + c_0(t), c_j(t) = P c_j(t-1) + Q_j e_{j,t}$$ The contributions sum exactly to the smoothed state (deviations from steady state); this identity is verified internally.
Usage
qpm_decompose(fit, vars = NULL)

# S3 method for class 'qpm_decomposition'
plot(x, var = NULL, drop_zero = TRUE, periods = NULL, ...)
Arguments
- fit
A
qpm_filtrationfromqpm_filter().- vars
Variables to keep (default: all declared variables).
- x
A
qpm_decomposition.- var
Variable to plot.
- drop_zero
Drop components that never contribute.
- periods
Optional integer window of period indices to display (e.g.
81:110for the last 30 quarters).- ...
Unused.
Value
A long data frame of class qpm_decomposition with columns
period, variable, component (shock names plus "initial"),
and value (contribution, in deviations from steady state).
plot() draws a stacked-bar decomposition with the smoothed total
overlaid.
Examples
sol <- qpm_solve(qpm_template("bkl"))
obs <- simulate(sol, nsim = 60, seed = 3, burn = 20)
fit <- qpm_filter(sol, obs[, c("period", "pi", "i", "q")])
dec <- qpm_decompose(fit)
plot(dec, var = "pi")